Portfolio & activity
Two views — Portfolio for what you currently hold, Activity for what's happened. Both paginate at five per page and link directly into the Polymarket market for context.
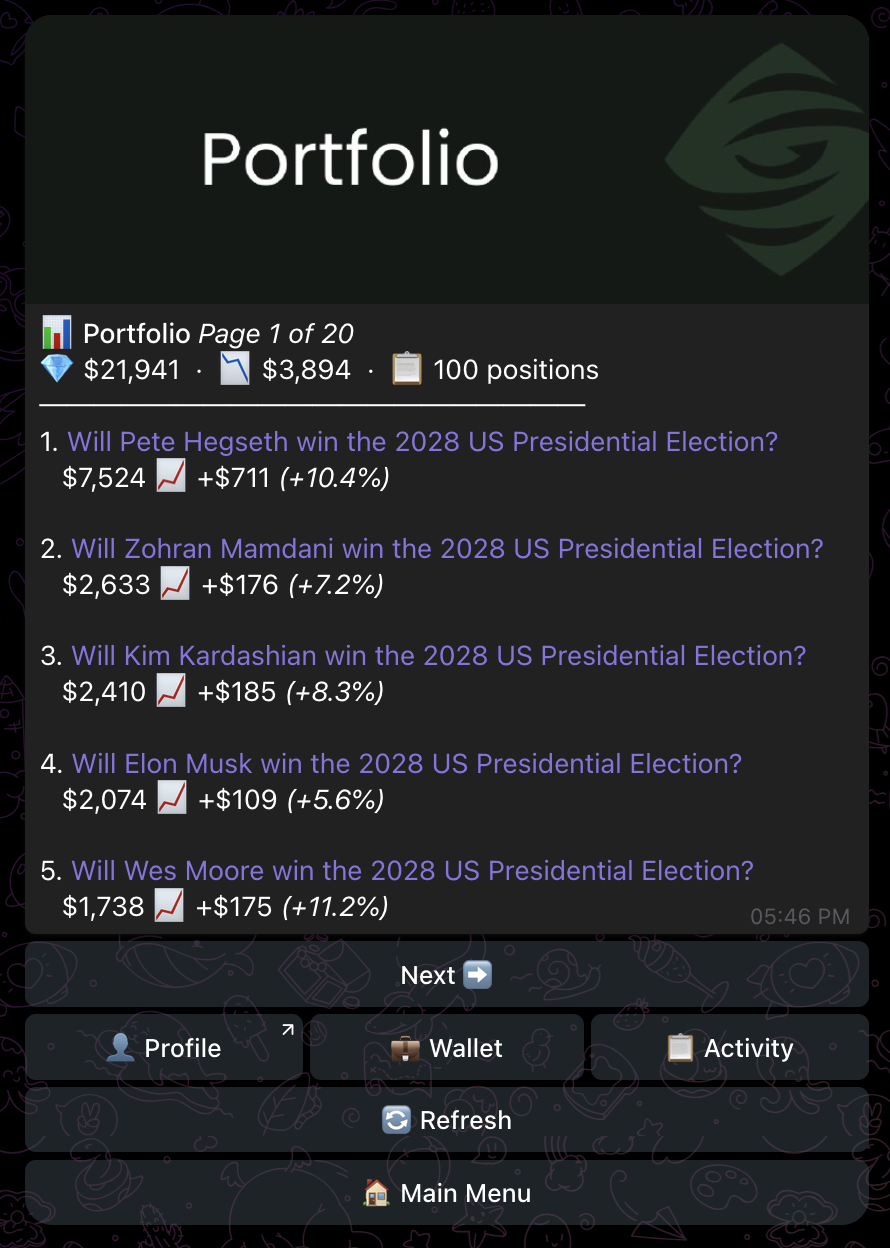
Portfolio
Tap 📊 Portfolio from the main menu. The header shows your position count, total value, total realized P&L (in dollars), and the current page if you have more than five positions.
Each position card shows:
- Market question (linked to the Polymarket event page).
- Current value — what those shares are worth at the current book price.
- P&L — green 📈 if you're up, red 📉 if you're down, with the dollar delta.
- Percentage return on cost basis.
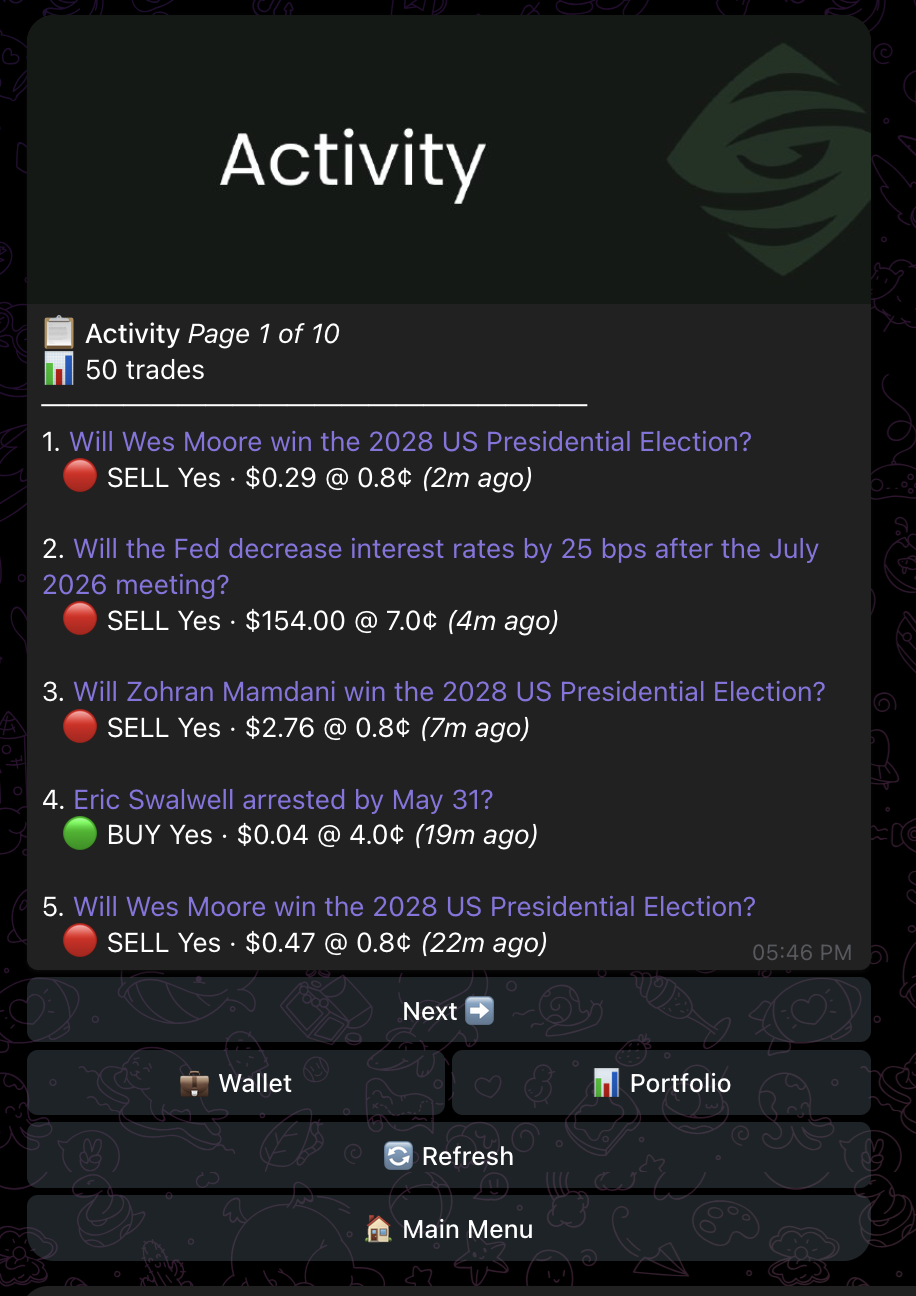
Activity
Tap 📋 Activity for a chronological feed of every trade — both your own and the copy trades placed automatically. Five per page, newest first.
Each row shows:
- Market question (linked).
- Side — 🟢 BUY (entering) or 🔴 SELL (exiting).
- Outcome (Yes / No), dollar amount, fill price in cents.
- Relative timestamp ("just now", "2h ago").
If a copy trade was skipped because of your settings — out of price range, over a market limit, or below the size floor — it shows up in Activity with a skip reason rather than a fill. This is the easiest way to check if your rules are too strict.
How P&L is calculated
Mirrored uses Polymarket's own position and PnL endpoints — the numbers in the bot match what you see on polymarket.com when logged in with your address. P&L is realized once a market resolves; until then, it's mark-to-book at the current best bid.
Exports
A CSV export of full trade history is on the roadmap. For now, your full Polymarket activity is queryable via the public data API using your master wallet address — see Wallet for where to find it.